

Please tell me what you thought about this blog. Comments, suggestions and views are welcomed.


myConstrains[constrains_] :=
 Block[{num, s, mycon}, num = Length[constrains];
  mycon =
   Table[If[Head[constrains[[i]]] === LessEqual,
     constrains[[i]][[1]] + s[i] == constrains[[i]][[2]],
     If[Head[constrains[[i]]] === Equal,
      constrains[[i]][[1]] + R[i] == constrains[[i]][[2]],
      constrains[[i]][[1]] - s[i] + R[i] ==
       constrains[[i]][[2]]]], {i, num}];
  mycon /. x__[y_] :> ToExpression[ToString[x] <> ToString[y]]]

LPstd[obj_, mycons_] :=
 Block[{myvar, basicvars, nonbasicvars, AB, BM, c, A, B, rowindex1,
   rowindex2}, myvar = Variables[mycons[[All, 1]]];
  myvar =
   Flatten[{Sort@
      Select[myvar, Not@StringStartsQ[SymbolName[#], "s" | "R"] &],
     Sort@Select[myvar, StringStartsQ[SymbolName[#], "s"] &],
     Sort@Select[myvar, StringStartsQ[SymbolName[#], "R"] &]}];
  AB = {Coefficient[mycons[[All, 1]], #] & /@
     Select[myvar, Not@StringStartsQ[SymbolName[#], "s" | "R"] &],
    Coefficient[mycons[[All, 1]], #] & /@
     Select[myvar, StringStartsQ[SymbolName[#], "s"] &],
    Coefficient[mycons[[All, 1]], #] & /@
     Select[myvar, StringStartsQ[SymbolName[#], "R"] &]};
  AB = Transpose@Flatten[AB, 1];
  AB = Join[{Flatten[
      Table[Select[myvar,
        StringStartsQ[SymbolName[#], i] &], {i, {"x", "s", "R"}}]]},
    AB];
  c = Flatten[{Table[
      Coefficient[obj, #] & /@
       Select[myvar, StringStartsQ[SymbolName[#], i] &], {i, {"x",
        "s"}}], Table[-BM, {Length[
        Select[myvar, StringStartsQ[SymbolName[#], "R"] &]]}], 0}];
  basicvars =
   Select[AB[[All, #]] & /@ (Flatten /@
        Map[Position[myvar, #] &,
         Tuples[myvar, {Length[mycons]}], {2}]), #[[2 ;; -1]] ===
       IdentityMatrix[Length[mycons]] &][[1, 1]];
  nonbasicvars =
   Flatten[Table[
     Select[Complement[myvar, basicvars],
      StringStartsQ[SymbolName[#], i] &], {i, {"x", "s", "R"}}]];
  c = Flatten@{c[[Flatten[Position[myvar, #] & /@ nonbasicvars]]],
     c[[Flatten[Position[myvar, #] & /@ basicvars]]], 0};
  AB = Join[{Flatten@{nonbasicvars, basicvars}},
    Flatten /@
     Transpose@{AB[[2 ;; -1]][[All,
         Sort[Flatten[Position[myvar, #] & /@ nonbasicvars]]]],
       IdentityMatrix[Length[mycons]]}];
  rowindex1 = c[[-Length[basicvars] - 1 ;; -2]];
  rowindex2 = Range[Length[mycons]];
  Flatten[{c -
       Total[rowindex1[[#]]*
           Flatten[{AB[[2 ;; -1]][[rowindex2[[#]]]],
             mycons[[rowindex2[[#]], 2]]}] & /@
         Range[Length@rowindex1]],
      AB[[2 ;; -1]][[All,
        Sort[Flatten[Position[myvar, #] & /@ nonbasicvars]]]],
      IdentityMatrix[Length[mycons]], mycons[[All, 2]],
      Flatten@{Sort@
         Select[nonbasicvars, StringStartsQ[SymbolName[#], "x"] &],
        Sort@Select[nonbasicvars,
          StringStartsQ[SymbolName[#], "s"] &],
        Sort@Select[nonbasicvars,
          StringStartsQ[SymbolName[#], "R"] &]}, basicvars} & /@
    Range[2], 1]]

simplexmethod[c_, A_, B_, b_, xnb_, xb_, cp_, Ap_, Bp_, bp_, xnbp_,
  xbp_] :=
 Block[{cB, nA, nB, mysymbol, pivotCol, AB, leaveVarpos, Bnew, xbnew,
   xnbnew, Anew, cnew, znew, z, BM, ABp},
   (*初始化變數*)
   nA = Length[xnb];
   nB = Length[xb];

  (*建立符號變數*)
  mysymbol = Flatten@{xnbp, xbp};

  (*找出進入變數(最負的檢驗數)*)
  pivotCol = PositionSmallest[-c[[1 ;; -2]] /. BM -> 10^6][[1]];

  (*合併A和B矩陣*)
  AB = Flatten /@ Transpose[{A, B}];
  Print@MatrixForm@AB;
  ABp = Flatten /@ Transpose[{Ap, Bp}];
  leaveVarpos =
   PositionSmallest[
     b/(If[# <= 0, 10^-6, #] & /@ AB[[All, pivotCol]] /. BM -> 10^6) /.
      x_ /; x <= 0 -> 10^6][[1]];

  (*更新基變數和非基變數*)
  xbnew = xb /. xb[[leaveVarpos]] -> mysymbol[[pivotCol]];
  xnbnew = xnb /. mysymbol[[pivotCol]] -> xb[[leaveVarpos]];
  Bnew =
   ABp[[All, Flatten[Position[mysymbol, #] & /@ Flatten@{xbnew}]]];
  cB = cp[[Flatten[Position[mysymbol, #] & /@ xbnew]]];

  (*計算新的檢驗數和目標函數值*)
  znew = Flatten[{cB . Inverse[Bnew] . Ap - cp[[1 ;; nA]],
      cB . Inverse[Bnew], cB . Inverse[Bnew] . bp - cp[[-1]]}] //
    FullSimplify;

  (*顯示單形法表格*)
  Print[Grid[
    Insert[Flatten /@
      Transpose[{Flatten[{z, xbnew}],
        Insert[Map[Flatten,
          Transpose[{Inverse[Bnew] . Ap, Inverse[Bnew],
            Inverse[Bnew] . bp}]], znew, 1]}],
     Flatten[{Item["BasicVariable",
        Background -> Lighter[Yellow, 0.9]], mysymbol, "Solution"}],
     1], Frame -> All,
    Background -> {{Lighter[Gray, 0.8]}, {Lighter[Yellow, 0.9],
       Lighter[Pink, 0.9]}}, ItemStyle -> Directive[FontSize -> 16],
    Spacings -> {Table[5, {Length[mysymbol] + 3}], 2}]];

  (*返回更新後的參數*)
  {-Flatten@{cB . Inverse[Bnew] . Ap - cp[[1 ;; nA]],
       cB . Inverse[Bnew]}, Inverse[Bnew] . Ap, Inverse[Bnew],
    Inverse[Bnew] . bp, xnbnew, xbnew, cp, Ap, Bp, bp, xnbp, xbp} //
   FullSimplify]
Nest[simplexmethod @@ # &,
 LPstd[-15 x1 - 20 x2,
  myConstrains[{x1 + 2 x2 >= 10, 2 x1 - 3 x2 <= 6, x1 + x2 >= 6}]], 2]

You can download searoute from
https://github.com/eurostat/searoute
.
port = {
 {"Shanghai, China", 31.2304, 121.4737},
 {"Guangzhou, China", 23.1291, 113.2644},
 {"Rotterdam, Netherlands", 51.9225, 4.4792},
 {"Antwerp, Belgium", 51.2194, 4.4025},
 {"Valencia, Spain", 39.4699, -0.3763},
 {"Los Angeles, USA", 33.7405, -118.2719},
 {"New York/New Jersey, USA", 40.6687, -74.0451},
 {"Savannah, USA", 32.0809, -81.0912},
 {"Santos, Brazil", -23.9608, -46.3336},
 {"Buenos Aires, Argentina", -34.6037, -58.3816},
 {"Itajai, Brazil", -26.9101, -48.6703},
 {"Tangier Med, Morocco", 35.8844, -5.5036},
 {"Port Said, Egypt", 31.2653, 32.3019},
 {"Durban, South Africa", -29.8587, 31.0218},
 {"Melbourne, Australia", -37.8136, 144.9631},
 {"Auckland, New Zealand", -36.8485, 174.7633},
 {"Brisbane, Australia", -27.4698, 153.0251},
 {"Singapore, Singapore", 1.3521, 103.8198},
 {"Kaohsiung, Taiwan", 22.6273, 120.3014},
 {"Busan, South Korea", 35.1796, 129.0756},
 {"Hong Kong, China", 22.3193, 114.1694},
 {"Tanjung Pelepas, Malaysia", 1.3673, 103.5386},
 {"Jebel Ali, UAE", 25.015, 55.0633},
 {"Colombo, Sri Lanka", 6.9271, 79.8612},
 {"Felixstowe, UK", 51.9556, 1.3111},
 {"Algeciras, Spain", 36.1408, -5.4562},
 {"Vancouver, Canada", 49.2827, -123.1207},
 {"Port Klang, Malaysia", 3.0089, 101.3678},
 {"Laem Chabang, Thailand", 13.0846, 100.8956},
 {"Tokyo, Japan", 35.6828, 139.7595},
 {"Yokohama, Japan", 35.4437, 139.6380}
};

Export["/Users/yourname/Desktop/searoute/text.csv",
Insert[
Flatten@{#[[1,1]]<>" to "<>#[[2,1]],
Round[#[[1,3]],0.1],Round[#[[1,2]],0.1],
Round[#[[2,3]],0.1],Round[#[[2,2]],0.1]}&/@
Select[
Flatten[Table[{port[[i]],port[[j]]},
{i,Length@port},{j,Length@port}],1],
#[[1]]!=#[[2]]&
],
{"routename","olon","olat","dlon","dlat"},1]
];

RunProcess[{"java","-jar",
"/Users/yourname/Desktop/searoute/searoute.jar",
"/Users/yourname/Desktop/searoute/text.csv",
"-res","5","-panama","1","-suez","1"}]

route=Import["/Users/yourname/Desktop/searoute/out.geojson",
"Data"][[2,2]];

mypath=Flatten@{#[[2,2]],StringSplit["routename"/.#[[3,2]]," to "],
"distKM"/.#[[3,2]]}&/@route;

myrule=Rule@@@Transpose@{Tally[mypath[[All,2]]][[All,1]],
Range[Length@port]};

distMatrix=ParallelTable[If[i==j,Infinity,
ToExpression@Select[mypath/.myrule,
#[[2]]==i&&#[[3]]==j&][[1,-1]]],
{i,Length@port},{j,Length@port}];

tour=FindShortestTour[Range[Length@port],
DistanceFunction->(distMatrix[[#1,#2]]&)];

myline=ParallelTable[
If[i==j,{},Select[mypath/.myrule,#[[2]]==i&&#[[3]]==j&][[1,1]]],
{i,Length@port},{j,Length@port}];

myline=myline[[#[[1]],#[[2]]]]&/@Partition[tour[[2]],2,1];

GeoGraphics[{
Red,PointSize[Large],
Point[GeoPosition[port[[All,{2,3}]]]],
Blue,Thick,myline},
GeoRange->"World",
GeoCenter->GeoPosition[{20,-150}],
GeoRange->Quantity[180,"AngularDegrees"]
]

Concise and elegant!
g=Graph[
{1\[DirectedEdge]2,1\[DirectedEdge]3,2\[DirectedEdge]3,
2\[DirectedEdge]4,3\[DirectedEdge]5,4\[DirectedEdge]3,
4\[DirectedEdge]5,4\[DirectedEdge]6,5\[DirectedEdge]6},
EdgeWeight->{1,12,9,3,5,3,13,15,4},
EdgeLabels->Rule@@@Transpose@{
{1\[DirectedEdge]2,1\[DirectedEdge]3,2\[DirectedEdge]3,
2\[DirectedEdge]4,3\[DirectedEdge]5,4\[DirectedEdge]3,
4\[DirectedEdge]5,4\[DirectedEdge]6,5\[DirectedEdge]6},
{1,12,9,3,5,3,13,15,4}},
VertexStyle->Yellow,VertexSize->0.5,
VertexShapeFunction->{{Yellow,Disk[#1,0.1],Black,Text[#2,#1]}&}]

route={{1,2,1},{1,3,12},{2,3,9},{2,4,3},{3,5,5},{4,3,4},{4,5,13},{5,6,4},{4,6,15}};

myroute=Select[Table[Select[route,#[[2]]==z&],{z,1,6}],#=!={}&]

Table[Set[v[temp],
SortBy[If[#[[1]]==1,{v[temp],#[[3]]},{v[temp],v[#[[1]]]+#[[3]]}]&/@
Select[Flatten[myroute,1],#[[2]]==temp&],Last][[1,2]]],{temp,2,6}]&/@Range[2]

test=ImageData[Rasterize["50",RasterSize->50,ImageSize->200]]

data=ParallelTable[{i,j,If[Mean@test[[i,j]]>0.95,0,1]},
{i,Dimensions[test][[1]]},{j,Dimensions[test][[2]]}]

picdata=Table[ParallelMap[If[#[[-1]]==0,"",
ImageResize[Import[RandomChoice[FileNames["*.jpeg",
"/Users/chungyuandye/Pictures/照片圖庫V4.photoslibrary/originals/",Infinity]]],{100,100}]]&,
data[[i]]],{i,54}]

GraphicsGrid[picdata]

session=StartExternalSession["Julia"]
test =
  "function testpi(size)
    sample = rand(size, 2)
    dist = broadcast(hypot, sample[:,1], sample[:,2])
    return sample, dist
end";
pitest=ExternalEvaluate[session,test]
size=100000
data=pitest[size];
ListPlot[GatherBy[Transpose[data[[1]]],Norm[#]<1&],Frame ->True,AspectRatio -> 1]
Length@GatherBy[Transpose[data[[1]]], Norm[#]<1&][[1]]/size//N


\documentclass[tikz]{standalone}
\usepackage{tikz}
\usepackage{ifthen}
\begin{document}
  \begin{tikzpicture}
	\draw[help lines, color=gray!30, dashed] (-1.2,1.5) grid (-1.2,1.5);
	\draw[->] (-1.2,0)--(1.1,0) node[right]{$x$};
	\draw[->] (0,-1.2)--(0,1.5) node[above]{$y$};
	\draw[domain=0:1, smooth, variable=\x, black] plot ({\x}, {sqrt(1-\x*\x)});
  \pgfmathsetseed{42}
    \foreach \i in {1,...,10000}
    {
      \pgfmathsetmacro{\x}{abs(rand)}
      \pgfmathsetmacro{\y}{abs(rand)}
      \pgfmathsetmacro{\r}{\x*\x+\y*\y}
       \pgfmathsetmacro{\col}{ifthenelse(\r<1,"blue!90","red!90")}
      \fill[\col] (\x,\y) circle (0.1pt)
      ;
    }
  \end{tikzpicture}
\end{document}

ClearAll["Global`*"]
\[Alpha]=0.3;
\[Beta]=0.95;
\[Delta]=0.1;
\[Sigma]=1.5;

size=99;

K=Range[0.1,5,4.9/(size)];
V=Table[0,{size}];


astHoward=With[{n=size},
obj=ParallelTable[If[i^\[Alpha]+(1-\[Delta])*i-j<0,-10^9,
((i^\[Alpha]+(1-\[Delta])*i-j)^(1-\[Sigma])-1)/(1-\[Sigma])],
{i,0.1,5,4.9/n},{j,0.1,5,4.9/n}];
loops=0;
\[Epsilon]=99999;

Print[Grid[{
{"loop number ",
Dynamic[loops],
" with distance ",
Dynamic[NumberForm[\[Epsilon],
ExponentFunction->(If[-10<#<10,Null,#]&)]]}}]];

NestWhile[
NestWhile[
Transpose@
Table[{obj[[i,#[[2,i]]]]+\[Beta]*#[[1,#[[2,i]]]],#[[2,i]]},{i,Length[#[[1]]]}]&,
Transpose[SortBy[#,First][[-1]]&/@
Table[{obj[[i,j]]+\[Beta]*#[[1,j]],j},{i,n+1},{j,n+1}]//Parallelize],
Norm[#1[[1]]-#2[[1]]]>10^-6&,2]&,
{Table[0,n+1],Table[0,n+1]},
(loops++;\[Epsilon]=Norm[#1[[1]]-#2[[1]]];
Norm[#1[[1]]-#2[[1]]]>10^-6)&,2]
]


astHowardMatrix=With[{n=size},
obj=ParallelTable[If[i^\[Alpha]+(1-\[Delta])*i-j<
0,-10^9,((i^\[Alpha]+(1-\[Delta])*i-j)^(1-\[Sigma])-1)/(1-\[Sigma])],
{i,0.1,5,4.9/n},{j,0.1,5,4.9/n}];
loops=0;
\[Epsilon]=99999;

Id=IdentityMatrix[size+1];

Print[Grid[{
{"loop number ",
Dynamic[loops],
" with distance ",
Dynamic[NumberForm[\[Epsilon],
ExponentFunction->(If[-10<#<10,Null,#]&)]]}}]];


NestWhile[
(
myValue=Transpose[SortBy[#,First][[-1]]&/@
Table[{obj[[i,j]]+\[Beta]*#[[1,j]],j},{i,n+1},{j,n+1}]//Parallelize];
{Inverse[(Id-\[Beta]*Normal[SparseArray[
Rule[#,1]&/@Transpose[
{Range[size+1],myValue[[2]]}],size+1]])].(obj[[#[[1]],#[[2]]]]&/@
Transpose[{Range[size+1],myValue[[2]]}]),myValue[[2]]}
)&,
{Table[0,n+1],Table[0,n+1]},
(loops++;\[Epsilon]=Norm[#1[[1]]-#2[[1]]];
Norm[#1[[1]]-#2[[1]]]>10^-6)&,2]
]


ListLinePlot[astHowardMatrix[[1]],PlotRange->All,AspectRatio->1,Frame->True]
ListLinePlot[astHowardMatrix[[2]],PlotRange->All,AspectRatio->1,Frame->True]

ClearAll[\[Beta],\[Gamma],xGrid,u,v0];

(*Parameters*)
\[Beta]=0.96;
\[Gamma]=1.5;
xMin=10^-3;
xMax=2.5;
nGrid=120;
xGrid=Subdivide[xMin,xMax,nGrid-1];

(*Utilityfunction*)
u[c_]:=If[\[Gamma]==1,Log[c],(c^(1-\[Gamma]))/(1-\[Gamma])];

(*Initialguess*)
v0=Table[0,{x,xGrid}];

(* Bellman Operator T *)
myT[v_List]:=Block[{myf,x},
myf[x_]=Interpolation[Transpose@{xGrid,v},InterpolationOrder->1][x];
Max/@Quiet@Table[
(c^(1-\[Gamma]))/(1-\[Gamma])+\[Beta]*myf[x-c],
{x,xGrid},{c,Select[xGrid,#<=x&]}
]];

(* Value Function Iteration using NestWhile *)
myvfi=NestWhileList[myT,v0,Norm[#1-#2]>=0.00001&,2];

(* Plotting the results *)
ListLinePlot[Transpose[{xGrid,#}]&/@myvfi[[2;;-1]]]
 利用三角板(30°-60°-90°)轉半圈即可。
pt[x0_]:={{0,0},{x0,Sqrt[4-x0^2]},{x,Sqrt[3-x^2]},{0,0}}/.
Quiet@Solve[{x^2+y^2==3,(x-x0)^2+(y-Sqrt[4-x0^2])^2==1},{x,y}][[2]]

Manipulate[
Plot[{Sqrt[4-x^2],Sqrt[3-x^2]},{x,-2,2},AspectRatio->1/2,
Epilog->{Green,Thickness[0.005],
Line[pt[Sqrt[3+10^(-7)]][[1;;3]]],
Red,PointSize[0.02],Point[pt[Sqrt[3+10^(-7)]]],
Point[pt[z][[1;;3]]],
Blue,Line[pt[z][[1;;2]]],Line[pt[z][[2;;3]]],
Line[pt[z][[3;;4]]]}
],{z,Sqrt[3]+10^(-7),-2}]

Integrate[Sqrt[4-x^2]-Sqrt[3-x^2],{x,0,Sqrt[3]}]

Integrate[Sqrt[4-x^2]-Sqrt[3](2+x),{x,-2,-(3/2)}]+
Integrate[Sqrt[4-x^2]-Sqrt[3-x^2],{x,-(3/2),Sqrt[3]}]//FullSimplify

splitdata[datatemp___]:=Block[{eqn,temp,x,y,group,vertex,ans},
temp=SortBy[datatemp,Left][[{1,-1}]];
eqn[x_,y_]=y-temp[[1,2]]-
(temp[[1,2]]-temp[[2,2]])/(temp[[1,1]]-temp[[2,1]])(x-temp[[1,1]]);
group={Select[datatemp,eqn[#[[1]],#[[2]]]> 0&],
Select[datatemp,eqn[#[[1]],#[[2]]]< 0&]};

vertex={SortBy[group[[1]],Abs@eqn[#[[1]],#[[2]]]&][[-1]],
SortBy[group[[2]],Abs@eqn[#[[1]],#[[2]]]&][[-1]]};

ans={{{temp[[1]],vertex[[1]]},
Select[group[[1]],RegionMember[
Polygon[Insert[temp,vertex[[1]],-1]],#]==False&&#[[1]]< vertex[[1,1]]&]},
{{temp[[2]],vertex[[1]]},
Select[group[[1]],RegionMember[
Polygon[Insert[temp,vertex[[1]],-1]],#]==False&&#[[1]]> vertex[[1,1]]&]},
{{temp[[1]],vertex[[2]]},
Select[group[[2]],RegionMember[
Polygon[Insert[temp,vertex[[2]],-1]],#]==False&&#[[1]]< vertex[[2,1]]&]},
{{temp[[2]],vertex[[2]]},
Select[group[[2]],RegionMember[
Polygon[Insert[temp,vertex[[2]],-1]],#]==False&&#[[1]]> vertex[[2,1]]&]}
};

If[Length[#[[2]]]==0,{#[[1]],{#[[1,1]]}},{#[[1]],#[[2]]}]&/@ans
];

convexhull[{p1__,p2__},datatemp___]:=Block[{eqn,temp,x,y,group,vertex,ans},
temp=SortBy[{p1,p2},Left];
If[Length[datatemp]==0,{{temp,{}},{temp,{}}},
If[Length[datatemp]==1,{{{temp[[1]],datatemp[[1]]},{}},
{{temp[[2]],datatemp[[1]]},{}}},

eqn[x_,y_]=y-temp[[1,2]]-(temp[[1,2]]-temp[[2,2]])/
(temp[[1,1]]-temp[[2,1]])(x-temp[[1,1]]);

vertex=SortBy[datatemp,Abs@eqn[#[[1]],#[[2]]]&][[-1]];

group={Select[datatemp,#[[1]]< vertex[[1]]&],
Select[datatemp,#[[1]] > vertex[[1]]&]};

ans={{{temp[[1]],vertex},
Select[group[[1]],RegionMember[Polygon[Insert[temp,vertex,-1]],#]==
False&&#[[1]]< vertex[[1]]&]},
{{vertex,temp[[2]]},
Select[group[[2]],RegionMember[Polygon[Insert[temp,vertex,-1]],#]==
False&&#[[1]]> vertex[[1]]&]}}
]]
];

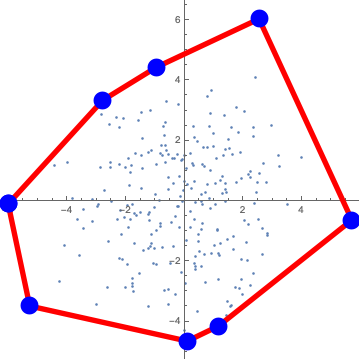
data=RandomReal[NormalDistribution[0,2],{250,2}];
Needs["ComputationalGeometry`"]

test=splitdata[data];
xx=Nest[Flatten[convexhull@@@#,1]&,test,3];
myline=Line/@Tally[xx[[All,1]]][[All,1]];
mypts=Point@Tally[xx[[All,1]]][[All,1,1]];

ListPlot[data,AspectRatio->1,
Epilog->{Red,Thickness[0.015],myline,Blue,PointSize[0.05],mypts}]

python3 -m pip install --upgrade pip
python3 -m pip install jupyter
from notebook.auth import passwd; passwd()
jupyter notebook --generate-config
vi ~/.jupyter/jupyter_notebook_config.py
c.NotebookApp.ip='*' #*表示所有IP,這裡設定ip為都可訪問
c.NotebookApp.password = '填寫剛剛生成的密文'
c.NotebookApp.open_browser = False # 禁止notebook啟動時自動開啟瀏覽器
c.NotebookApp.port =9999 #指定訪問的埠,預設是8888。
wolframscript configure-jupyter.wls add啟動 Jupyter notebook

xx=Import["http://www.fishbase.org/summary/Decapterus-maruadsi.html","Table"];
StringJoin[#<>""&/@Cases[xx,{"Fisheries:",___},Infinity][[1,1;;-2]]]

mytwoaxistikz[data__,{xmin_,xmax_,ymin_,ymax_},mycolor__,{xlabel_,ylabel_},{rticks__,lticks__},
linelabel__,linepos__,plotaspectratio_:1]:=Block[{temp=data,axis1,axis2,textpos,line},

axis1="
\\begin{axis}[
 scale only axis,
 axis y line*=left,
 xtick pos=left,
 xscale="<>ToString[N@plotaspectratio]<>",
 xmin="<>ToString[xmin]<>",xmax="<>ToString[xmax]<>",
 ymin="<>ToString[ymin]<>",ymax="<>ToString[ymax]<>",
 xlabel="<>xlabel<>",ylabel="<>ylabel<>",
 ytick="<>ToString[lticks]<>"]\n";

textpos=StringJoin[Table["
 \\node[] at (axis cs:"<>ToString[linepos[[z,1]]]<>","<>
ToString[linepos[[z,2]]]<>") {"<>linelabel[[z]]<>"};",
{z,Length@temp}]];

line=StringJoin[Table["
\\addplot[color="<>If[ListQ[mycolor[[z]]],
ToString[mycolor[[z,1]]]<>","<>ToString[mycolor[[z,2]]],
ToString[mycolor[[z]]]]<>",mark=none,line width=0.5mm] coordinates{\n"
 <>StringJoin["("<>ToString[#[[1]]]<>","<>ToString[#[[2]]]<>")\n"&/@temp[[z]]]<>"};",
{z,Length@temp}]]
<>"\n\\end{axis}\n";

axis2="\n\\begin{axis}[
 scale only axis,
 axis y line*=right,
 xtick pos=left,
 xscale="<>ToString[N@plotaspectratio]<>",
 xmin="<>ToString[xmin]<>",xmax="<>ToString[xmax]<>",
 ymin="<>ToString[ymin]<>",ymax="<>ToString[ymax]<>",
 ytick="<>ToString[rticks]<>"]\n";

"\\begin{tikzpicture}"<>axis1<>textpos<>line<>axis2<>"\n\\end{axis}\n\\end{tikzpicture}"
]


data=RandomVariate[BinormalDistribution[{1,2},{1.5,2},0.6],10000];

ListPlot[data,PlotRange->{{-5,8},{-5,8}},Axes->None,
Frame->True,AspectRatio->1,ImageSize->350,
FrameLabel->{
{Automatic,
Histogram[data[[All,2]],{-5,8,0.5},AspectRatio->0.2,
Axes->None,BarOrigin->Top,ImageSize->275]},
{Automatic,
Histogram[data[[All,1]],{-5,8,0.5},AspectRatio->0.2,
Axes->None,BarOrigin->Bottom,ImageSize->275]}}
]

Show[DensityHistogram[data,{0.5},ColorFunction->(White&),
Method->{"DistributionAxes"->"Histogram"}],ListPlot[data]]


mydate[date_]:=Block[{temp},
temp=Import[
"http://www.twse.com.tw/exchangeReport/MI_INDEX.html?date="<>ToString@date<>"&type=ALLBUT0999",
"JSON"];
{("data1"/.temp)[[All,{1,2,4,5}]],("data5"/.temp)[[All,
{1,2,3,4,5,6,7,8,9,11}]]}]

mydate[20170719][[1]] // TableForm
mydate[20170719][[2]] // TableForm

test=Quiet@{
{ToExpression@StringJoin@Characters[ToString@#][[1;;4]],
ToExpression@StringJoin@Characters[ToString@#][[5;;6]],
ToExpression@StringJoin@Characters[ToString@#][[7;;8]]},
mydate[#][[1,4]]}&/@Map[ToExpression@
StringJoin[ToString/@{#[[1]],
If[#[[2]]<10>ToString[#[[2]]],ToString[#[[2]]]],
If[#[[3]]<10>ToString[#[[3]]],
ToString[#[[3]]]]}]&,
DayRange["2017/05/1","2017/07/21"][[All,1]]]//Parallelize;

DateListPlot[{#[[1]],
ToExpression@StringReplace[#[[2,2]],","->""]}&/@
Select[test,Length@#[[2]]==4&],Filling->Bottom]


Block[{tempdata},
tempdata={#[[1]],ToExpression@StringReplace[#[[2,2]],","->""]}&/@
Select[test,Length@#[[2]]==4&];
DateListPlot[tempdata,Filling->Bottom,
Epilog->{Red,PointSize[0.025],Point[{tempdata[[#[[1]]]][[1]],#[[2]]}]&/@
FindPeaks[tempdata[[All,2]]]}]]

mylistplot[data_, xrange_, yrange_, pointsize_, colormap_, imagesize_] :=
  Module[{colors, styledData},
    colors = ColorData[colormap] /@ Rescale[data[[All, 2]], yrange];
    styledData = Style[#, colors[[#2]]] & @@@ Transpose[{data, Range[Length[data]]}];
    ListPlot[
      styledData,
      PlotTheme -> "Detailed",
      PlotStyle -> PointSize[pointsize],
      PlotRange -> {xrange, yrange},
      Frame -> True,
      ImageSize -> imagesize*GoldenRatio,
      PlotLegends -> Placed[
        BarLegend[{colormap, yrange}, LegendMarkerSize -> imagesize,
        LegendMargins -> {{0, 0}, {0, 0}}],Right
      ]
    ]
  ]


mylistplot[iris, {2, 4}, {0, 2.5}, 0.015, "TemperatureMap", 225]

Needs["RLink`"]

(* For Mac and MMA 10*)

SetEnvironment[ "DYLD_LIBRARY_PATH" ->"/Library/Frameworks/R.framework/Resources/lib"]
InstallR["RHomeLocation" -> "/Library/Frameworks/R.framework/Resources", "RVersion" -> 3];
REvaluate["R.version.string"]

(* Load packages*)

REvaluate["library(psych);"]
REvaluate["library(nortest);"]
REvaluate["library(GenABEL);"]

(* 因素分析,主成分法萃取,變異及大化法轉軸 *)

myfac=Map[REvaluate["{xx<-principal(iris[,1:4],nfactors="<>ToString[#]<>",
rotate=\"varimax\");xx$loadings}"]&,{2,3,4}];
myfac

(* 輸出因素負荷矩陣 *)

Reverse[SortBy[myfac[[1,1]],{#[[1]],#[[2]]}&]]//TableForm
TableForm/@myfac[[All,1]]


(* 因素分析資料*)

fadata = {
{1, 1, 1, 1, 1, 1, 1, 1, 1, 1, 3, 3, 3, 3, 3, 4, 5, 6},
{1, 2, 1, 1, 1, 1, 2, 1, 2, 1, 3, 4, 3, 3, 3, 4, 6, 5},
{3, 3, 3, 3, 3, 1, 1, 1, 1, 1, 1, 1, 1, 1, 1, 5, 4, 6},
{3, 3, 4, 3, 3, 1, 1, 2, 1, 1, 1, 1, 2, 1, 1, 5, 6, 4},
{1, 1, 1, 1, 1, 3, 3, 3, 3, 3, 1, 1, 1, 1, 1, 6, 4, 5},
{1, 1, 1, 2, 1, 3, 3, 3, 4, 3, 1, 1, 1, 2, 1, 6, 5, 4}};

(* 定義資料*)

RSet["factor", Transpose@fadata];

(* 在R中計算相關係數矩陣,傳回MMA小數後四捨五入 *)

Round[REvaluate["cor(factor)"], 0.0001] // MatrixForm

(* 因素分析 *)

REvaluate["factanal(factor, factors = 3)$loadings"]

(* 輸出因素負荷矩陣 *)

TableForm[#[[1]], TableHeadings -> {None, #[[-1, -1, -1, -1]]}] & /@
{REvaluate["factanal(factor, factors = 3)$loadings"]} // Column


(* 迴歸分析 *)

REvaluate["{
data(iris)
reg <- lm( Sepal.Length ~ Species, data=iris )
summary.text <- capture.output(print( summary(reg)) )
}"]

StringJoin@Riffle[#, "\n"] &@REvaluate["{
data(iris)
reg <- lm( Sepal.Length ~ Species, data=iris )
summary.text <- capture.output(print( summary(reg)) )
}"]

(* 產生常態隨機變數 *)

mydata=REvaluate["rnorm(100,mean=0,sd=1)"]&/@Range[100];

(* MMA次數分配 *)

\[ScriptCapitalD] = HistogramDistribution[mydata[[1]]]

(* MMA PDF & CDF *)

GraphicsRow[DiscretePlot[#[\[ScriptCapitalD], x], {x, -4, 4, .01},
PlotLabel -> #] & /@ {PDF, CDF}]

(* shapiro test, ks.test *)

shapiro[data_] := Block[{temp},
  RSet["temp", data];
  REvaluate[
 "{xx=shapiro.test(temp); yy=ks.test(temp,\"pnorm\",0,1); zz=lillie.test(temp);
 c(xx$statistic,xx$p.value,yy$statistic,yy$p.value,zz$statistic,zz$p.value)}"][[1]] ]

RSet["rn1", RandomReal[{0, 10}, 1000]];
rn2 = RandomReal[NormalDistribution[0, 1], 1000];
REvaluate["rntransform(rn1)"] // Short
Histogram[#, Frame -> True] & /@ {rn2, REvaluate["rntransform(rn1)"]}
ShapiroWilkTest[#, {"TestStatistic", "PValue"}] & /@ {rn2, REvaluate["rntransform(rn1)"]}


(* 利用RCurl擷取網路資料 *)

gosspost[n_]:=REvaluate["
{library(RCurl);
curl<-getCurlHandle();
curlSetOpt(cookie=\"over18=1\",followlocation=TRUE,curl=curl);
url<-\"https://www.ptt.cc/bbs/Gossiping/index" <> ToString[n] <>
".html\";
html<-getURL(url,curl=curl)
}"][[1]];

Gossiping =
  Cases[ImportString[
StringReplace[gosspost[#], {"\n" -> "", "\t" -> ""}],
"XMLObject"],
  XMLElement[
 "div", {"class" -> "r-ent"}, {XMLElement[
"div", {"class" -> "nrec"}, {XMLElement[
  "span", {"class" -> "hl f2"}, {_}]}],
  XMLElement["div", {"class" -> "mark"}, {}],
  XMLElement[
"div", {"class" -> "title"}, {XMLElement[
  "a", {"shape" -> "rect",
"href" -> postlink_}, {posttile_}]}],
  XMLElement[
"div", {"class" -> "meta"}, {XMLElement[
  "div", {"class" -> "date"}, {_}],
 XMLElement[
  "div", {"class" -> "author"}, {author_}]}]}] :> {postlink,
 posttile, author},
  Infinity] & /@ Range[20861, 20862, 1];

Flatten[Gossiping, 1] // TableForm

thesisnoworryhlm[ddata[[All,1;;15]],ddata[[All,16;;24]],
ddata[[All,25;;30]],{5,6,4},{4,5},{3,3},
{X1,X2,X3},{M1,M2},{Y1,Y2}]

thesisnoworryanova[ddata[[All,1;;15]],ddata[[All,16;;24]],
ddata[[All,25;;30]],{5,6,4},{4,5},{3,3},
{X1,X2,X3},{M1,M2},{Y1,Y2},
ddata[[All,{31,32,33}]],{"Sex","Age","Edu"}]


1+2Sin[2x]+3Sin[3x]+4Sin[4x]/.{Plus->List,Sin[y_]->1}