Stats

Popular Posts

Followers

顯示包含「Mathematica教學講義」標籤的文章。顯示所有文章

Mathematica 教學:Searoute for Traveling Salesman Problem

由 戴忠淵 於 2025年7月29日星期二 上午10:01 發表

You can download searoute from https://github.com/eurostat/searoute .

port = {
 {"Shanghai, China", 31.2304, 121.4737},
 {"Guangzhou, China", 23.1291, 113.2644},
 {"Rotterdam, Netherlands", 51.9225, 4.4792},
 {"Antwerp, Belgium", 51.2194, 4.4025},
 {"Valencia, Spain", 39.4699, -0.3763},
 {"Los Angeles, USA", 33.7405, -118.2719},
 {"New York/New Jersey, USA", 40.6687, -74.0451},
 {"Savannah, USA", 32.0809, -81.0912},
 {"Santos, Brazil", -23.9608, -46.3336},
 {"Buenos Aires, Argentina", -34.6037, -58.3816},
 {"Itajai, Brazil", -26.9101, -48.6703},
 {"Tangier Med, Morocco", 35.8844, -5.5036},
 {"Port Said, Egypt", 31.2653, 32.3019},
 {"Durban, South Africa", -29.8587, 31.0218},
 {"Melbourne, Australia", -37.8136, 144.9631},
 {"Auckland, New Zealand", -36.8485, 174.7633},
 {"Brisbane, Australia", -27.4698, 153.0251},
 {"Singapore, Singapore", 1.3521, 103.8198},
 {"Kaohsiung, Taiwan", 22.6273, 120.3014},
 {"Busan, South Korea", 35.1796, 129.0756},
 {"Hong Kong, China", 22.3193, 114.1694},
 {"Tanjung Pelepas, Malaysia", 1.3673, 103.5386},
 {"Jebel Ali, UAE", 25.015, 55.0633},
 {"Colombo, Sri Lanka", 6.9271, 79.8612},
 {"Felixstowe, UK", 51.9556, 1.3111},
 {"Algeciras, Spain", 36.1408, -5.4562},
 {"Vancouver, Canada", 49.2827, -123.1207},
 {"Port Klang, Malaysia", 3.0089, 101.3678},
 {"Laem Chabang, Thailand", 13.0846, 100.8956},
 {"Tokyo, Japan", 35.6828, 139.7595},
 {"Yokohama, Japan", 35.4437, 139.6380}
};

Export["/Users/yourname/Desktop/searoute/text.csv",
Insert[
Flatten@{#[[1,1]]<>" to "<>#[[2,1]],
Round[#[[1,3]],0.1],Round[#[[1,2]],0.1],
Round[#[[2,3]],0.1],Round[#[[2,2]],0.1]}&/@
Select[
Flatten[Table[{port[[i]],port[[j]]},
{i,Length@port},{j,Length@port}],1],
#[[1]]!=#[[2]]&
],
{"routename","olon","olat","dlon","dlat"},1]
];

RunProcess[{"java","-jar",
"/Users/yourname/Desktop/searoute/searoute.jar",
"/Users/yourname/Desktop/searoute/text.csv",
"-res","5","-panama","1","-suez","1"}]

route=Import["/Users/yourname/Desktop/searoute/out.geojson",
"Data"][[2,2]];

mypath=Flatten@{#[[2,2]],StringSplit["routename"/.#[[3,2]]," to "],
"distKM"/.#[[3,2]]}&/@route;

myrule=Rule@@@Transpose@{Tally[mypath[[All,2]]][[All,1]],
Range[Length@port]};

distMatrix=ParallelTable[If[i==j,Infinity,
ToExpression@Select[mypath/.myrule,
#[[2]]==i&&#[[3]]==j&][[1,-1]]],
{i,Length@port},{j,Length@port}];

tour=FindShortestTour[Range[Length@port],
DistanceFunction->(distMatrix[[#1,#2]]&)];

myline=ParallelTable[
If[i==j,{},Select[mypath/.myrule,#[[2]]==i&&#[[3]]==j&][[1,1]]],
{i,Length@port},{j,Length@port}];

myline=myline[[#[[1]],#[[2]]]]&/@Partition[tour[[2]],2,1];

GeoGraphics[{
Red,PointSize[Large],
Point[GeoPosition[port[[All,{2,3}]]]],
Blue,Thick,myline},
GeoRange->"World",
GeoCenter->GeoPosition[{20,-150}],
GeoRange->Quantity[180,"AngularDegrees"]
]
繼續閱讀全文 Mathematica 教學:Searoute for Traveling Salesman Problem

Mathematica 教學:Dijkstra Algorithm

由 戴忠淵 於 2024年11月24日星期日 下午4:26 發表

Concise and elegant!

g=Graph[
{1\[DirectedEdge]2,1\[DirectedEdge]3,2\[DirectedEdge]3,
2\[DirectedEdge]4,3\[DirectedEdge]5,4\[DirectedEdge]3,
4\[DirectedEdge]5,4\[DirectedEdge]6,5\[DirectedEdge]6},
EdgeWeight->{1,12,9,3,5,3,13,15,4},
EdgeLabels->Rule@@@Transpose@{
{1\[DirectedEdge]2,1\[DirectedEdge]3,2\[DirectedEdge]3,
2\[DirectedEdge]4,3\[DirectedEdge]5,4\[DirectedEdge]3,
4\[DirectedEdge]5,4\[DirectedEdge]6,5\[DirectedEdge]6},
{1,12,9,3,5,3,13,15,4}},
VertexStyle->Yellow,VertexSize->0.5,
VertexShapeFunction->{{Yellow,Disk[#1,0.1],Black,Text[#2,#1]}&}]

route={{1,2,1},{1,3,12},{2,3,9},{2,4,3},{3,5,5},{4,3,4},{4,5,13},{5,6,4},{4,6,15}};

myroute=Select[Table[Select[route,#[[2]]==z&],{z,1,6}],#=!={}&]

Table[Set[v[temp], 
SortBy[If[#[[1]]==1,{v[temp],#[[3]]},{v[temp],v[#[[1]]]+#[[3]]}]&/@
Select[Flatten[myroute,1],#[[2]]==temp&],Last][[1,2]]],{temp,2,6}]&/@Range[2]

繼續閱讀全文 Mathematica 教學:Dijkstra Algorithm

Mathematica 教學:非線性規劃

由 戴忠淵 於 2016年2月11日星期四 下午9:23 發表

繼續閱讀全文 Mathematica 教學:非線性規劃

Mathematica 教學:Central Limit Theorem

由 戴忠淵 於 2014年7月24日星期四 上午11:22 發表


Clear["Global`*"];
SetOptions[Plot,{Frame->True,Axes->None,PlotStyle->Red}];
SetOptions[Histogram,{Frame->True,Axes->None,ImageSize->350}];

mySumStdDist[dist_,parameters__,size_,repeat_,scale_]:=
Block[{x,y,domain,mydist,mysumdist,mypdf,normaldist,mu,sigma,
range,data1,data2,data3,data4,data1std,hist1,hist2,hist3,
hist4,normalplot,normalstdplot,histscale},
mydist=Apply[dist,parameters];

mysumdist=TransformedDistribution[Total[y[#]&/@Range[size]],
(y[#]\[Distributed]mydist)&/@Range[size]];

mu=Mean[mysumdist];
sigma=StandardDeviation[mysumdist];
domain=DistributionDomain[mysumdist];
range=If[Head[domain]===Interval,domain[[1]],domain];
range={Max[range[[1]],mu-3sigma],Min[range[[-1]],mu+3sigma]};

data1=RandomVariate[mysumdist,size];
data1std=Standardize@data1;
data2=RandomVariate[mydist,{repeat,size}];
data3=Total/@data2;
data4=Standardize[Mean/@data2];

(*直方圖*)

hist1=Histogram[data1,{Min[data1],Max[data1],
(Max[data1]-Min[data1])/20.},"PDF"];

hist2=Histogram[data1std,{Min[data1std],Max[data1std],
(Max[data1std]-Min[data1std])/20.},"PDF"];

hist3=Histogram[data3,{Min[data3],Max[data3],
(Max[data3]-Min[data3])/20.},"PDF"];

hist4=Histogram[data4,{Min[data4],Max[data4],
(Max[data4]-Min[data4])/20.},"PDF"];

normalplot=Plot[PDF[NormalDistribution[mu,sigma],x],{x,Min[data1],Max[data1]}];

normalstdplot=Plot[PDF[NormalDistribution[0,1],x],{x,-4,4}];

(*避免直方圖機率小於設定scale*)

histscale=Max[scale,Max[Cases[#,RectangleBox[a__,b__,___]:>b[[-1]],
Infinity]]]&/@{hist1,hist2,hist3,hist4};

(*圖形輸出*)

GraphicsGrid[
{{
Show[hist1,normalplot,
PlotRange->{0,histscale[[1]]},
PlotLabel->PlotLabel->"The distribution of Sum Xi"],

Show[hist2,normalstdplot,
PlotRange->{0,histscale[[2]]},
PlotLabel->"The distribution of Standardize Sum Xi"]},

{Show[hist3,normalplot,
PlotRange->{0,histscale[[3]]},
PlotLabel->"The central limit theorem for Sum Xi"],

Show[hist4,normalstdplot,
PlotRange->{0,histscale[[4]]},
PlotLabel->"The central limit theorem for Standardize sample mean"]
}},ImageSize->700]
];


Manipulate[
mySumStdDist[BinomialDistribution,{n,p},size,repeat,scale],
{{n,10},10,100,1,Appearance->"Labeled"},
{{p,0.2},0.1,0.9,0.1,Appearance->"Labeled"},
{{size,100},30,1000,1,Appearance->"Labeled"},
{{repeat,100},10,1000,1,Appearance->"Labeled"},
{{scale,0.5},0.01,1,0.01,Appearance->"Labeled"}
]

Manipulate[
mySumStdDist[GammaDistribution,{a,b},size,repeat,scale],
{{a,10},1,100,1,Appearance->"Labeled"},
{{b,0.5},0.1,1.5,0.1,Appearance->"Labeled"},
{{size,100},30,1000,1,Appearance->"Labeled"},
{{repeat,100},10,1000,1,Appearance->"Labeled"},
{{scale,0.5},0.01,1,0.01,Appearance->"Labeled"}
]
繼續閱讀全文 Mathematica 教學:Central Limit Theorem

Mathematica 教學 輸出講義所需的TeX語法

由 戴忠淵 於 2013年6月21日星期五 上午12:21 發表


懶惰是一種美德

handoutform[command_String] := Block[{text},
(*判斷語法是否多行*)
   text = StringSplit[command, "\n"];
(*輸出Mathematica計算結果*)
   Print@ToExpression[command];
(*若程式僅一行,TeX直接跳到下一列;若程式兩行,第一行換行第二行跳列;若三行中間行僅換行*)
   StringReplace["\\begin{mathenv}\n\\memo{}\n" <>
     Which[
      Length[text] == 1, 
      "\\mathin\n\\verb|" <> StringReplace[text[[1]], " " -> ""] <> 
       "|\\\\\n" ,
      Length[text] == 2, 
      "\\mathin \n\\verb|" <> StringReplace[text[[1]], " " -> ""] <> 
       "|\\newline \n\\verb|" <> StringReplace[text[[2]], " " -> ""] <>
        "|\\\\\n" ,
      Length[text] >= 3, 
      "\\mathin \n\\verb|" <> StringReplace[text[[1]], " " -> ""] <> 
       "|\\newline\n\\verb|" <> 
       StringJoin[
        StringReplace[#, " " -> ""] <> "|\\newline\n\\verb|" & /@ 
         text[[2 ;; -2]]] <> StringReplace[text[[-1]], " " -> ""] <> 
       "|\\\\\n"]
     <> "\\mathout $" <> ToString[TeXForm[ToExpression[command]]] <> 
     "$\n\\end{mathenv}", {"e^" -> "\\ex^"}]
   ];

(*設定圖形目錄*)
SetDirectory[];

handoutplotform[command_String, figurename_String] := Block[{text},
  text = StringSplit[command, "\n"];
  Print@ToExpression[command];
(*輸出圖形至指定目錄*)
  Export[figurename <> ".eps", ToExpression[command]];
  "\\begin{mathenv}\n\\memo{}\n" <>
   Which[
    Length[text] == 1, 
    "\\mathin \n\\verb|" <> StringReplace[text[[1]], " " -> ""] <> 
     "|\\\\\n" ,
    Length[text] == 2, 
    "\\mathin \n\\verb|" <> StringReplace[text[[1]], " " -> ""] <> 
     "|\\newline\n\\verb|" <> StringReplace[text[[2]], " " -> ""] <> 
     "|\\\\\n" ,
    Length[text] >= 3, 
    "\\mathin \n\\verb|" <> StringReplace[text[[1]], " " -> ""] <> 
     "|\\newline\n\\verb|" <> 
     StringJoin[
      StringReplace[#, " " -> ""] <> "|\\newline\n\\verb|" & /@ 
       text[[2 ;; -2]]] <> StringReplace[text[[-1]], " " -> ""] <> 
     "|\\\\\n"]
   <> "\\mathplot{" <> figurename <> "}\n\\end{mathenv}"
  ]

(*Example*)
handoutplotform["Plot[Sin[x],{x,0,2Pi}]", "test"]

handoutform["Integrate[24*x*y,{x,0,0.5},{y,1-x,1}]+
 Integrate[24*x*y,{x,0.5,1},{y,1-x,1.5-x}]"]

handoutform["PDF[NormalDistribution[],x]"]

Version 2.

Options[handoutform]={"Method"->"unList"};
handoutform[command_String,OptionsPattern[]]:=
Block[{myout,text,outputtex,arraytext,a,b,x,newlinepos,
newlinesign,listtex,method},

(*選項*)

Options[handoutform]={"Method"->"unList"};
method=OptionValue["Method"];

(*判斷語法是否多行*)

myout=ToExpression[command];

text=StringSplit[command,"\n"];

(*輸出Mathematica計算結果*)

outputtex=ToString@TeXForm[StandardForm@ToExpression[command]];
arraytext=
"{l"<>StringReplace[
StringCases[outputtex,"\\begin{array}{c"~~x__~~"c}"->x],
"c"->"l"]<>"l}";

listtex=If[method=="List",
newlinepos=StringPosition[outputtex,"\\}"];
newlinepos=
1+Accumulate[
Length/@
NestWhileList[
Cases[newlinepos,{a_,b_}/;#[[-1,2]]<
b<#[[-1,2]]+95]&,{{0,0}},#[[-1,2]]!=
newlinepos[[All,2]][[-1]]&][[2;;-2]]];
Print@myout;
TeXForm[Insert[myout,newlinesign,Partition[newlinepos,1]]],
Print@myout];

listtex=
StringReplace[ToString@listtex,
",\\text{newlinesign},"->"$,\\newline\n$"];

(*若程式僅一行,TeX直接跳到下一列;若程式兩行,第一行換行第二行跳列;若三行中間行僅換行*)

StringReplace[
"\\begin{mathenv}\n\\memo{}\n"<>
Which[Length[text]==1,
"\\mathin\n\\verb|"<>StringReplace[text[[1]],""->""]<>
"|\\\\\n",Length[text]==2,
"\\mathin\n\\verb|"<>StringReplace[text[[1]],""->""]<>
"|\\newline\n\\verb|"<>StringReplace[text[[2]],""->""]<>
"|\\\\\n",Length[text]>=3,
"\\mathin\n\\verb|"<>StringReplace[text[[1]],""->""]<>
"|\\newline\n\\verb|"<>
StringJoin[
StringReplace[#,""->""]<>"|\\newline\n\\verb|"&/@
text[[2;;-2]]]<>StringReplace[text[[-1]],""->""]<>
"|\\\\\n"]<>"\\mathout\n$"<>
If[method=="List",listtex,outputtex]<>"$\n\\end{mathenv}",

(*取代字串*)

{"e^"->"\\ex^",
"dx$"->"\\dx$",
"dy$"->"\\dy$",
"dz$"->"\\dz$",
"du$"->"\\du$",
"dv$"->"\\dv$",
"\\text{"~~ShortestMatch[a___]~~"}"->a,
"{c"~~ShortestMatch[b___]~~"c}"->arraytext,
"$\\begin{array}"->"\\matharray{\n\\begin{array}",
"\\end{array}$"->"\\end{array}\n}"}]];

(* Example *)

handoutform["N@Table[{x,Sin[x]},{x,0,2Pi,Pi/10}]"]
handoutform["N@Table[{x,Sin[x]},{x,0,2Pi,Pi/10}]","Method"->"List"]


繼續閱讀全文 Mathematica 教學 輸出講義所需的TeX語法

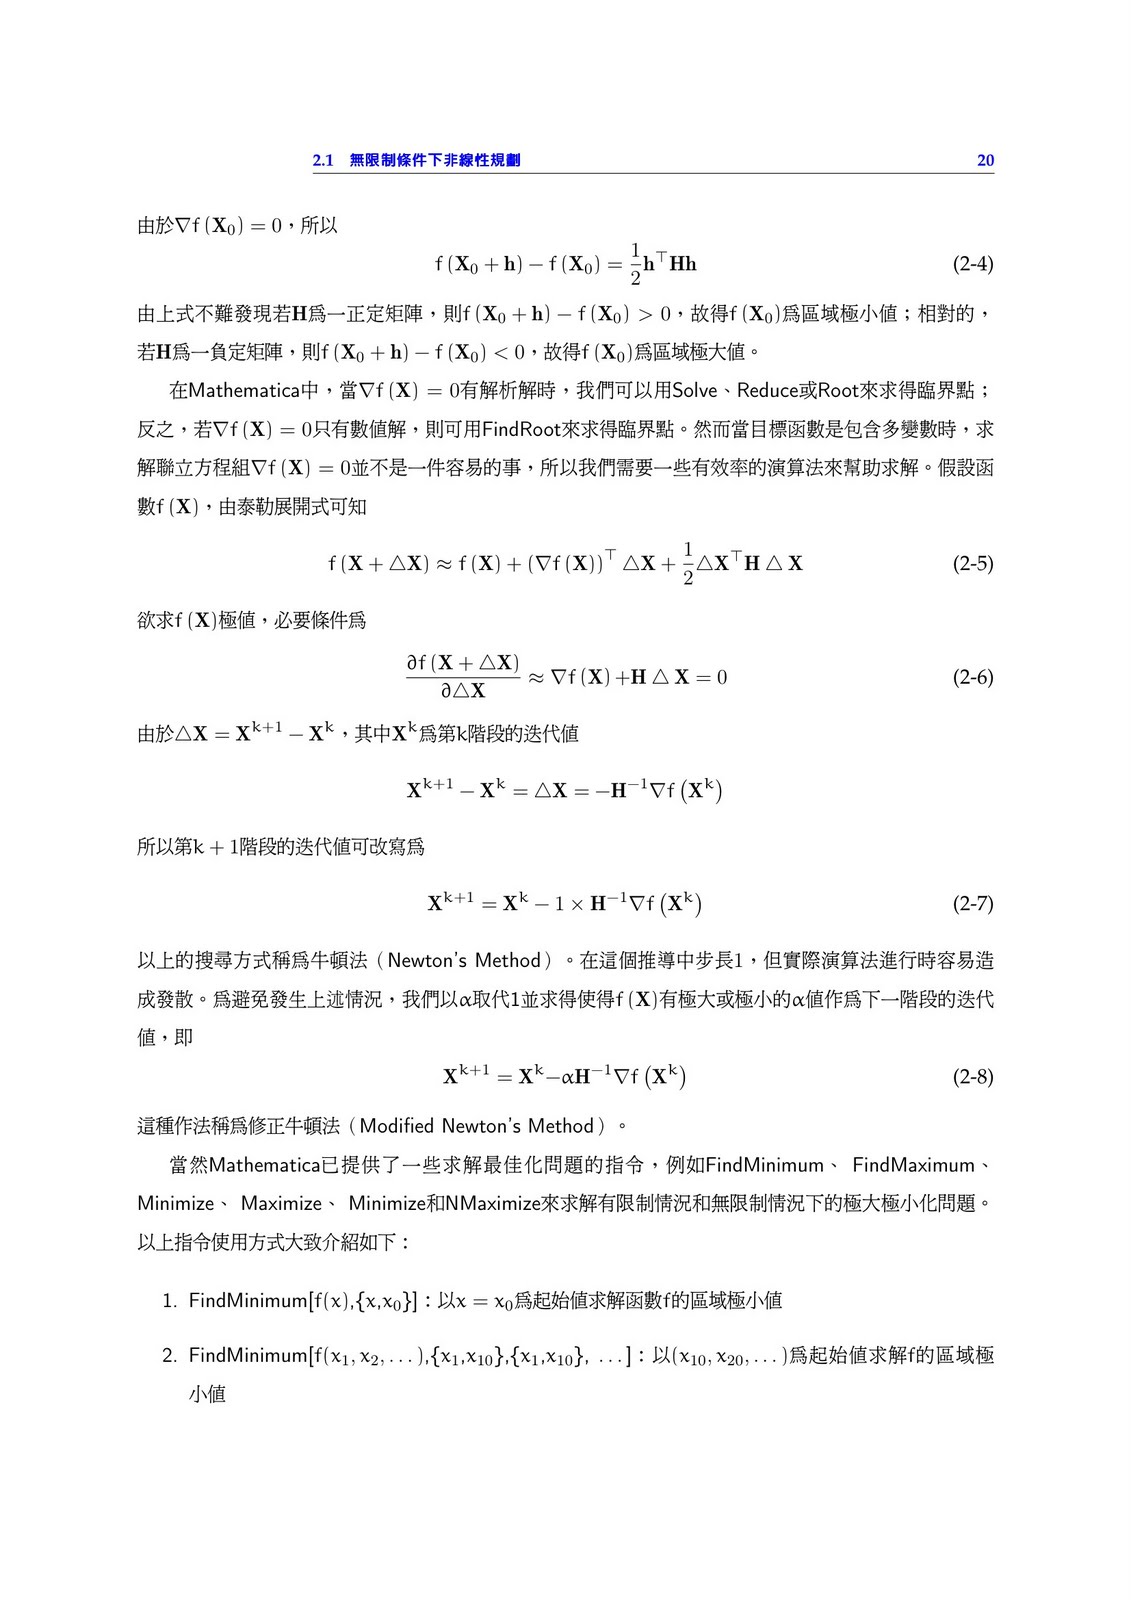
Mathematica 教學 無限制條件下最佳化

由 戴忠淵 於 2010年7月27日星期二 下午9:50 發表
繼續閱讀全文 Mathematica 教學 無限制條件下最佳化

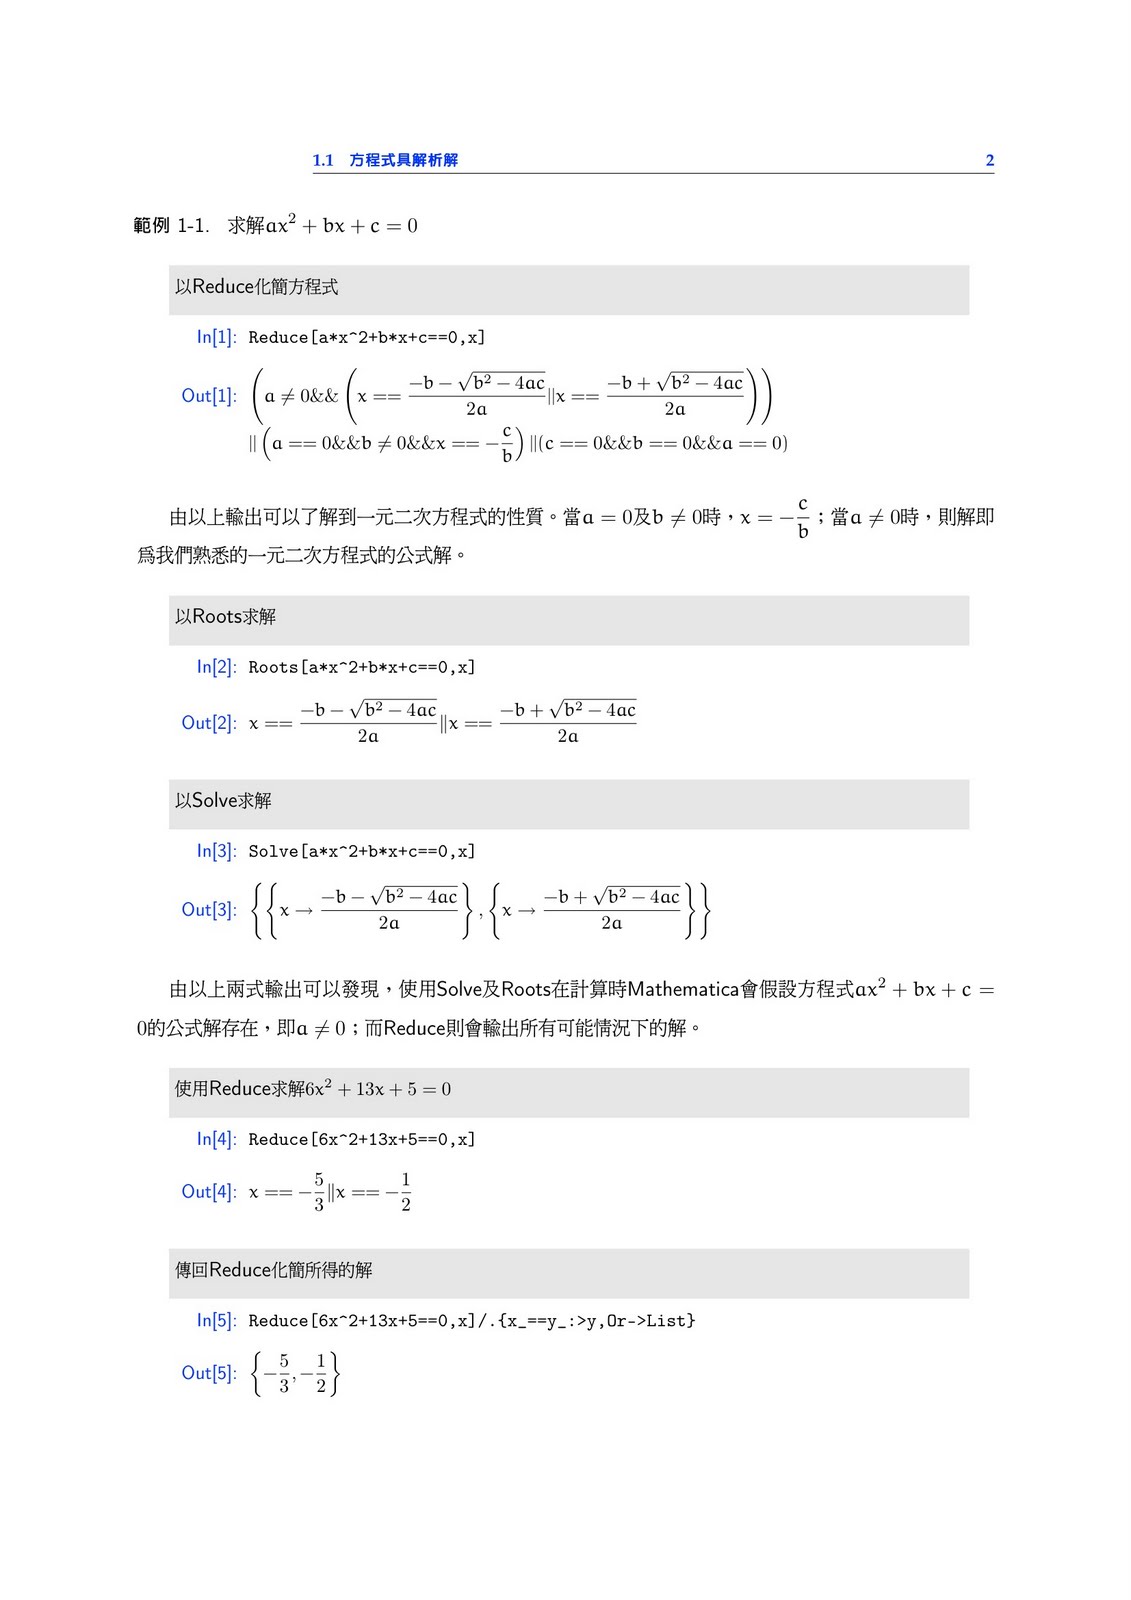
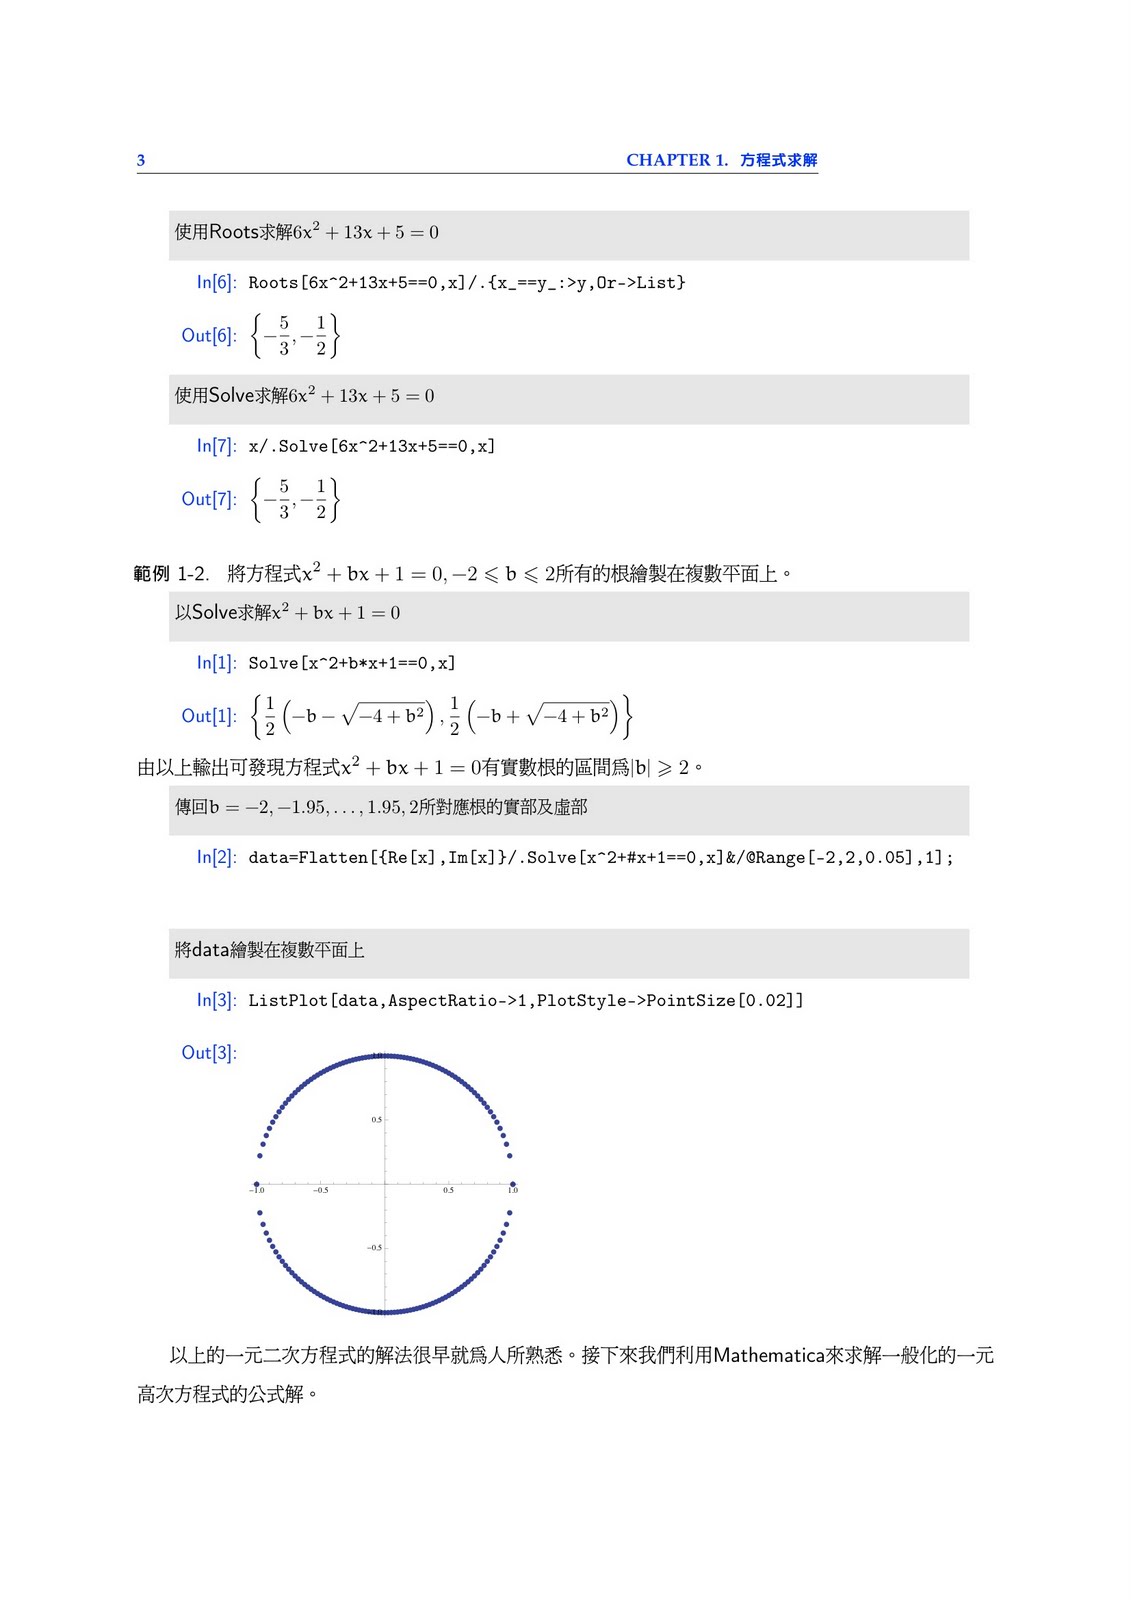
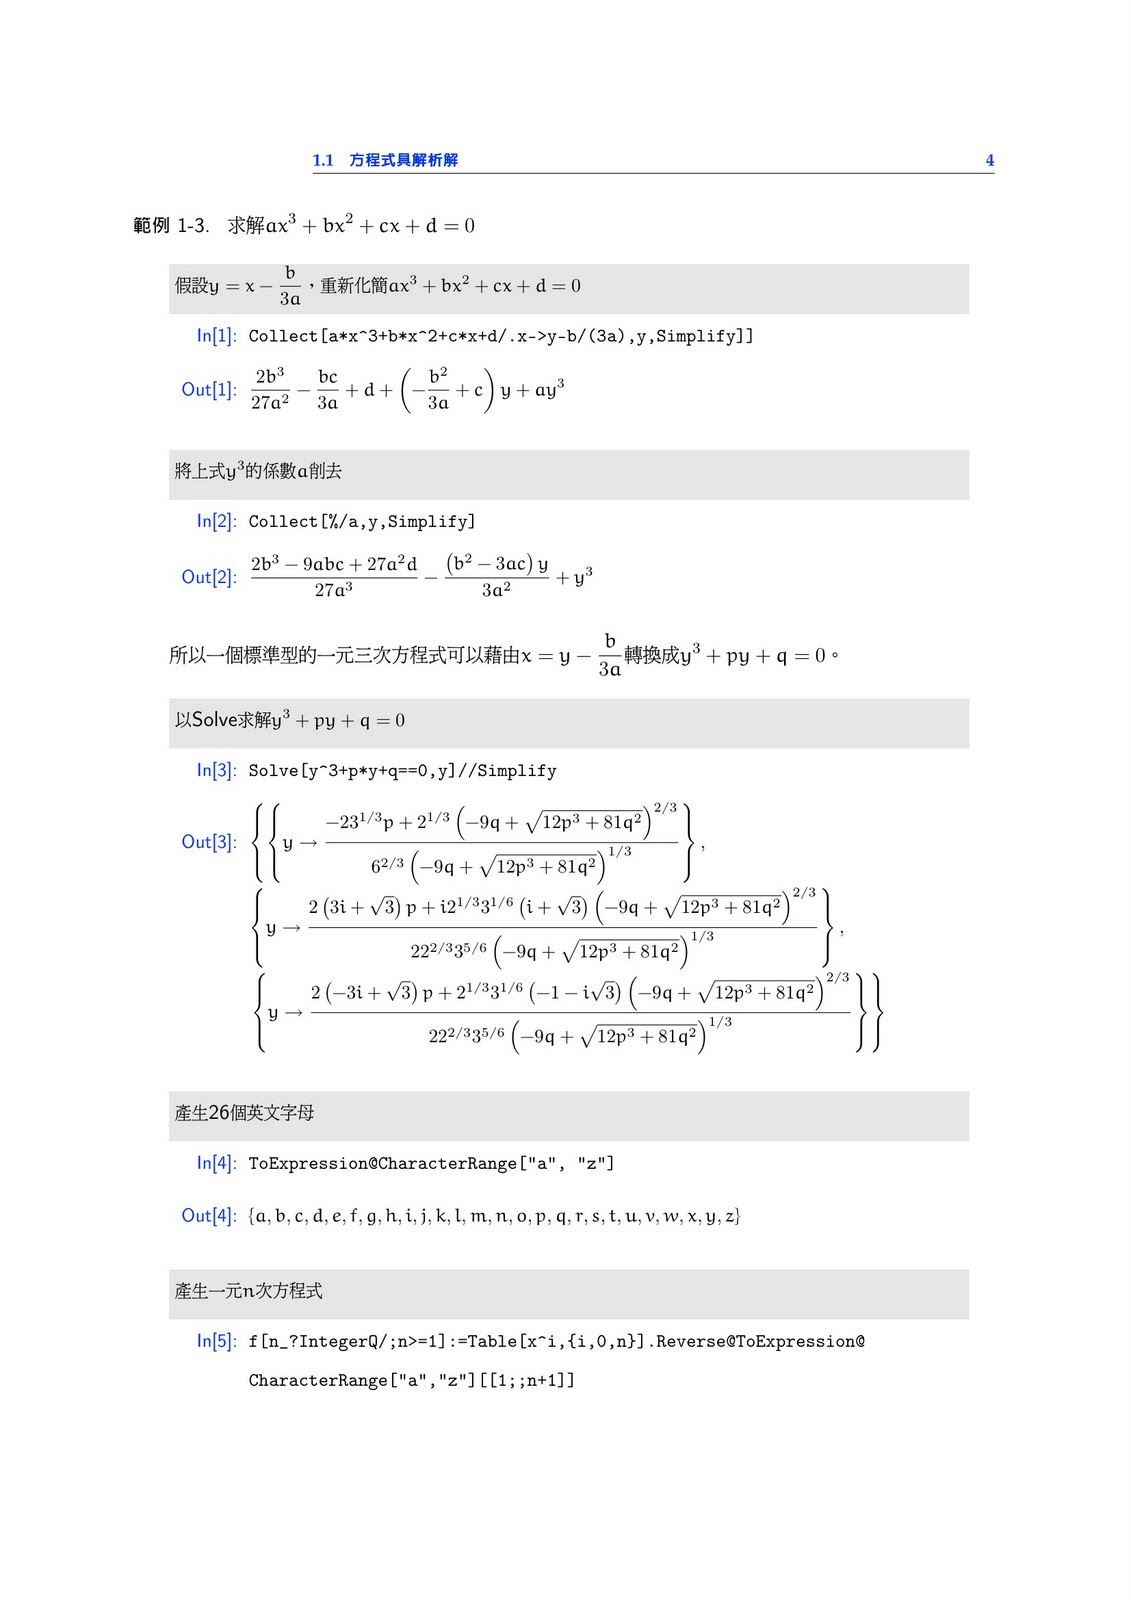
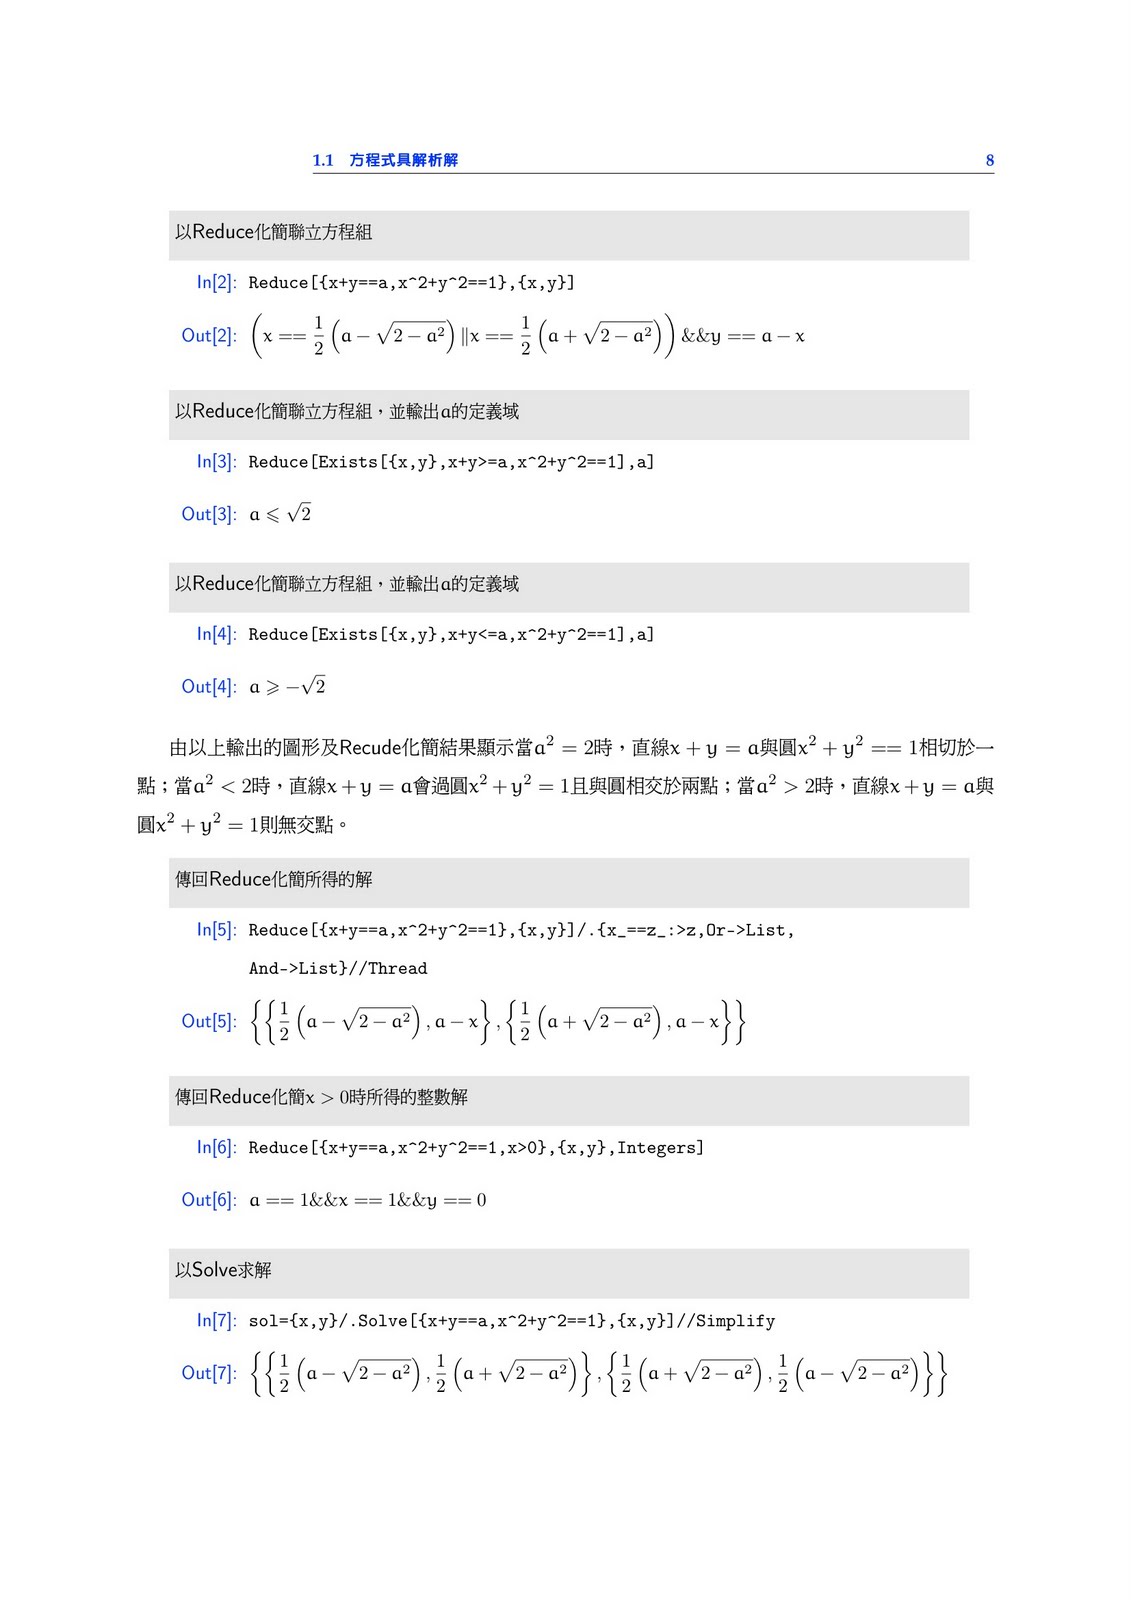
Mathematica 教學 方程式求解

由 戴忠淵 於 2010年7月18日星期日 上午7:59 發表

繼續閱讀全文 Mathematica 教學 方程式求解

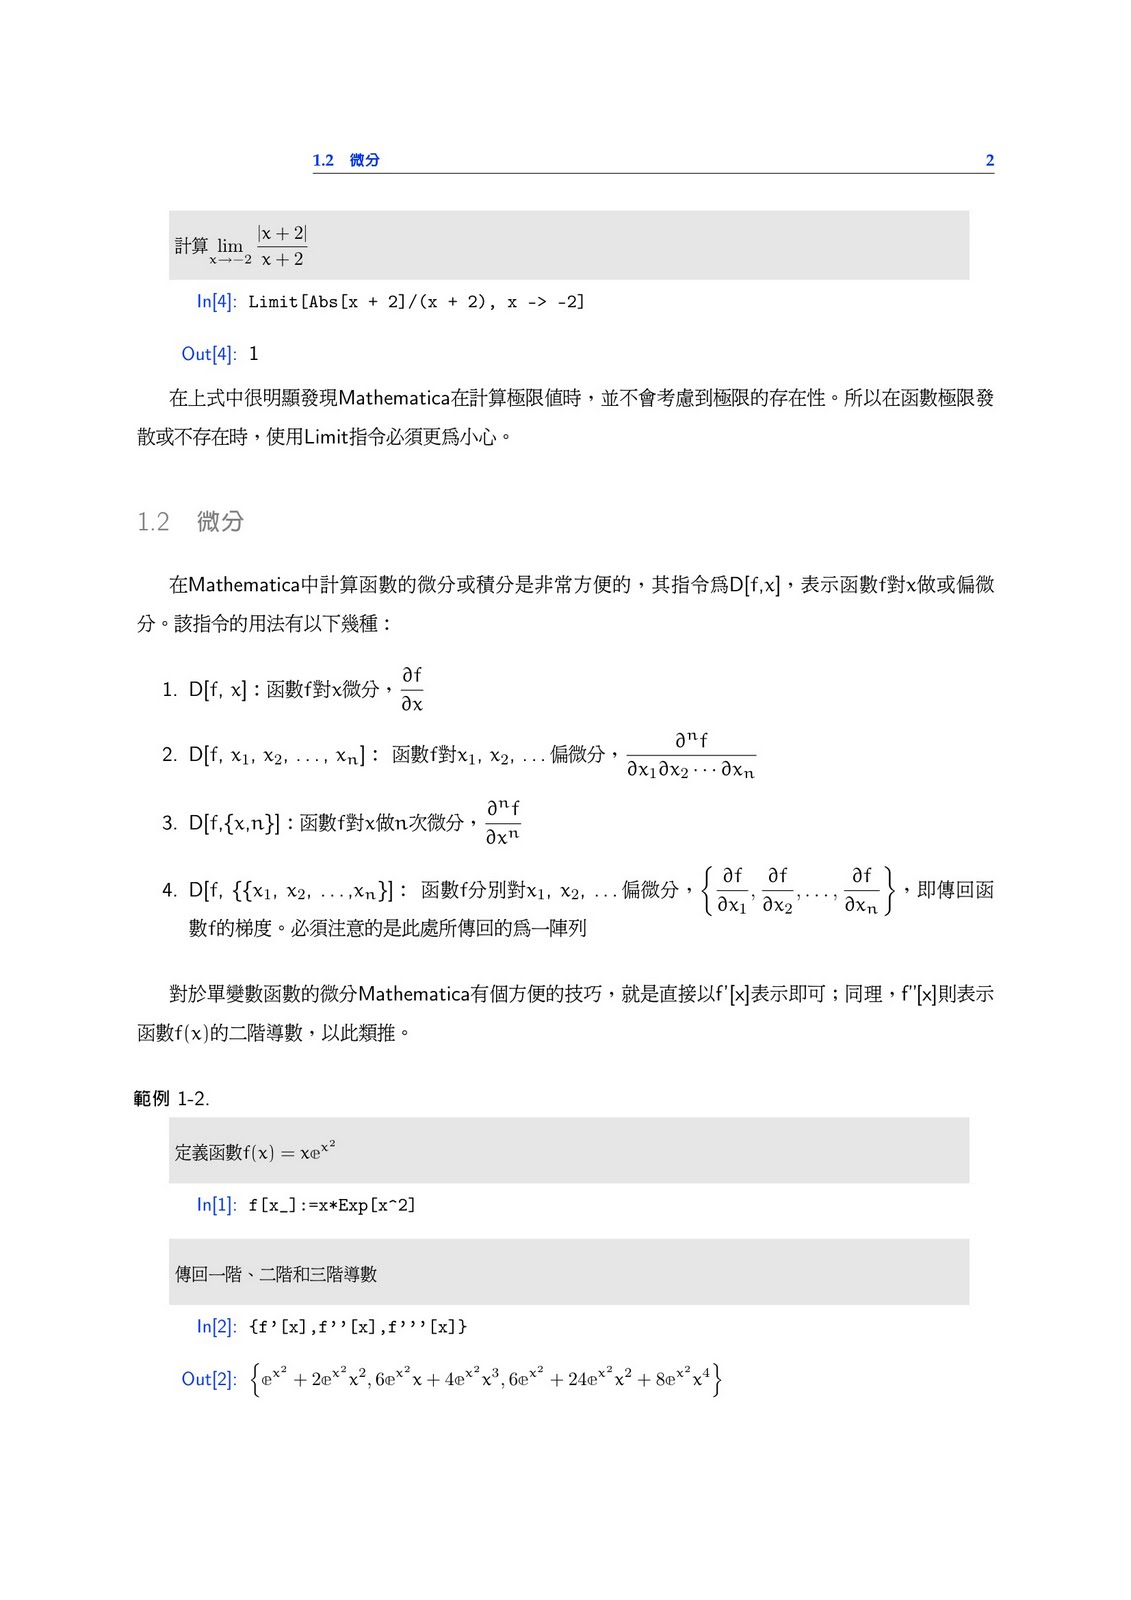
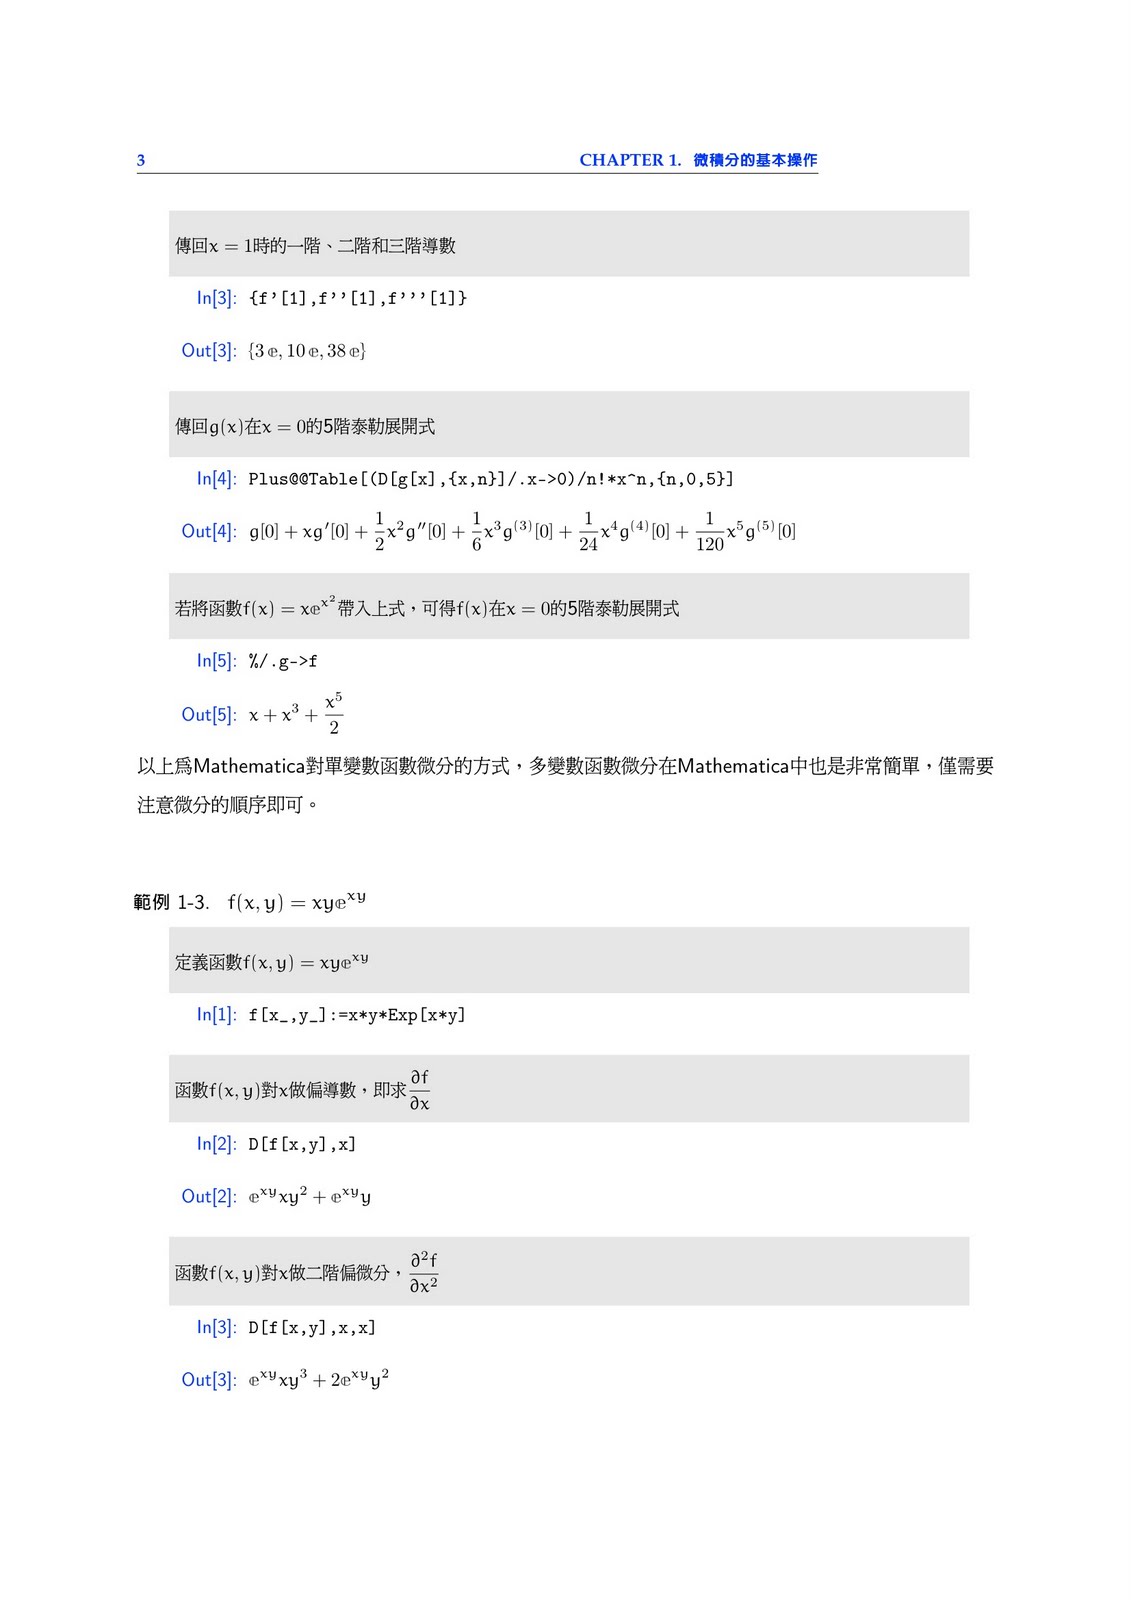
Mathematica 教學 微積分基本應用

由 戴忠淵 於 2010年7月11日星期日 上午8:04 發表

繼續閱讀全文 Mathematica 教學 微積分基本應用